Stress Assessment - BiLSTM Biosensor Data Fusion
About This Architecture
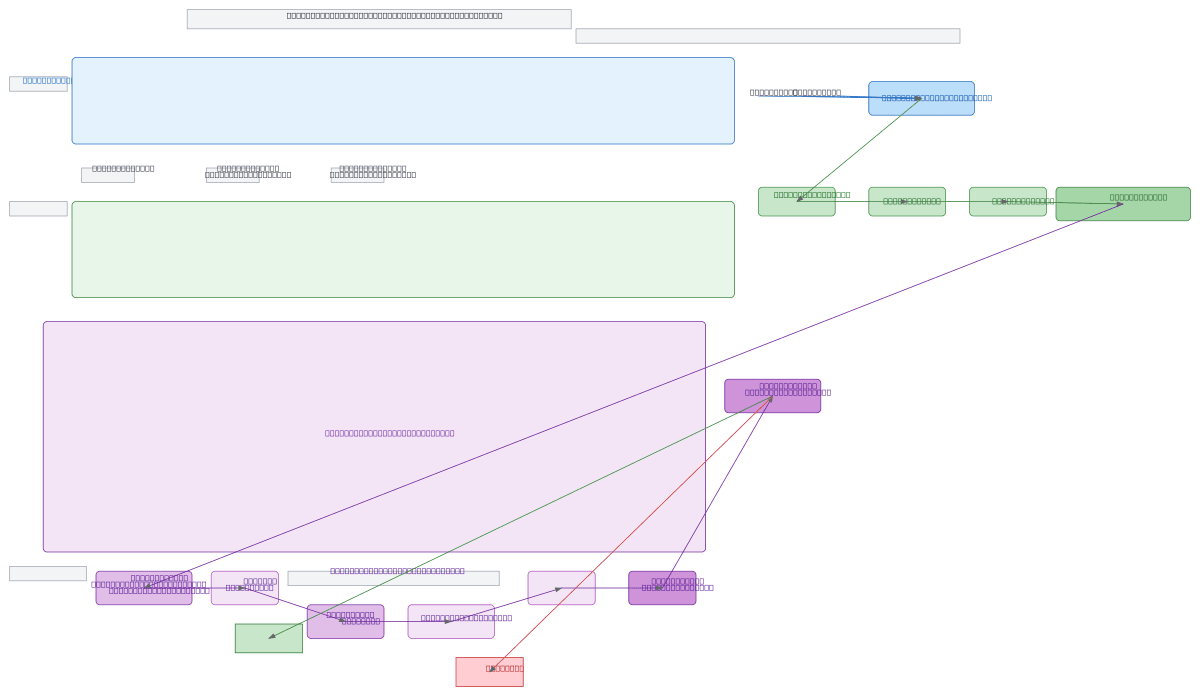
Multimodal stress detection pipeline fusing EEG, PPG, and temperature signals through a bidirectional LSTM classifier. Three biosensor modalities are synchronized via temporal sorting, segmented into 1199 windows of 256 timesteps, and normalized before feeding into a BiLSTM-LSTM stack with dropout and batch normalization. The architecture demonstrates best practices for handling asynchronous physiological data streams and preventing overfitting in time-series classification. Fork this diagram to customize layer sizes, window parameters, or add additional modalities like GSR or respiration rate.
People also ask
How do you build a machine learning model that fuses multiple biosensor signals like EEG, heart rate, and temperature to classify stress levels?
This diagram shows a complete BiLSTM pipeline that combines three biosensor modalities through temporal sorting and sliding window segmentation, then feeds normalized 1199×256×3 tensors into a bidirectional LSTM with dropout and batch normalization layers to output binary stress classification (Relaxed vs. Stressed).
- Domain:
- Ml Pipeline
- Audience:
- Machine learning engineers building multimodal biosensor stress detection systems
Generated by Diagrams.so — AI architecture diagram generator with native Draw.io output. Fork this diagram, remix it, or download as .drawio, PNG, or SVG.