Smart Water Monitoring - Sensing and Data
About This Architecture
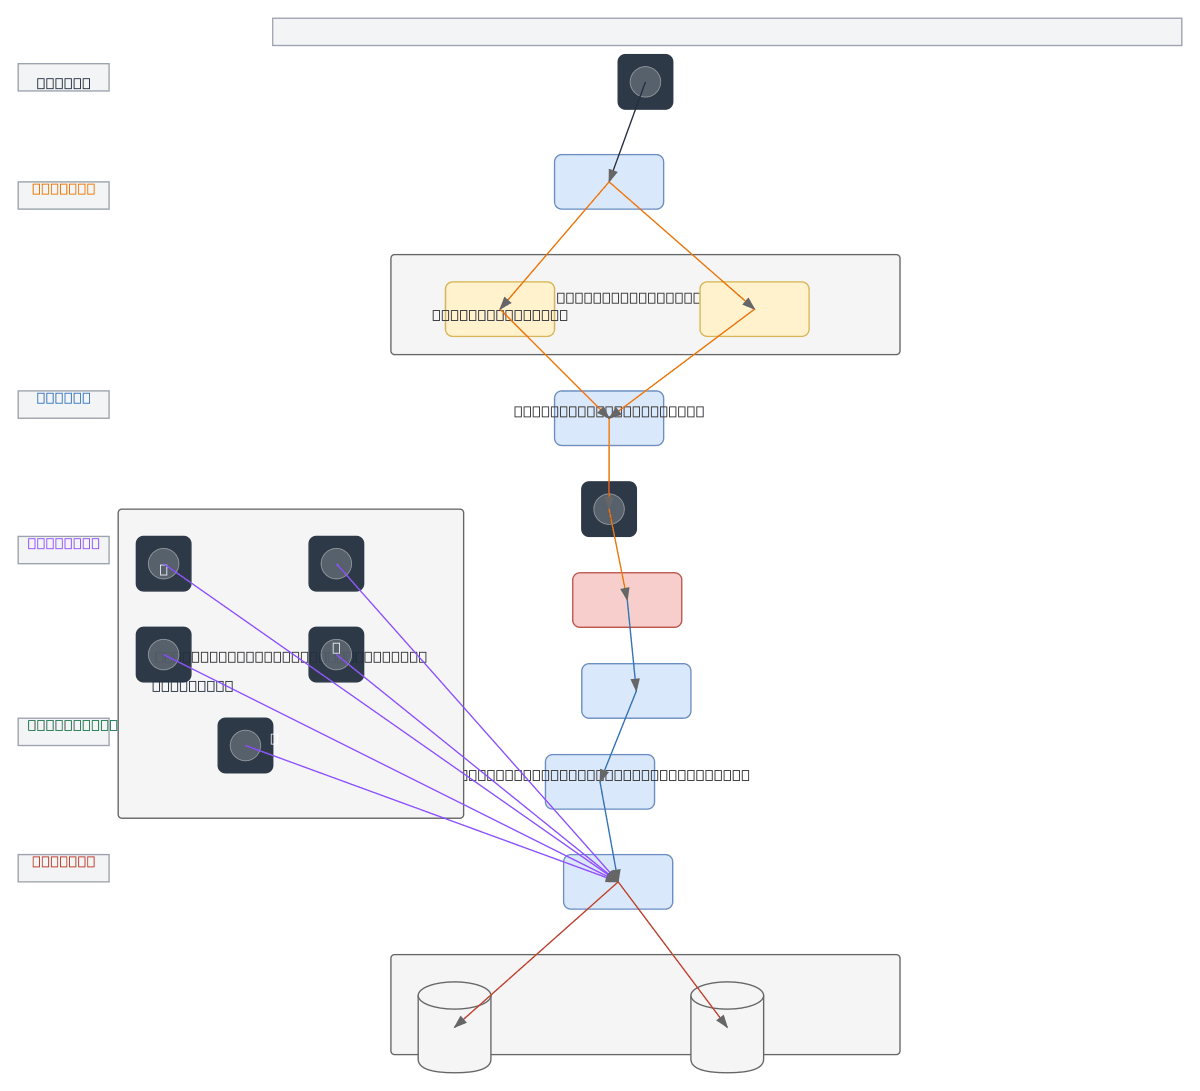
Smart water monitoring system combining dual-wavelength fluorescence spectroscopy with multi-parameter environmental sensing for real-time water quality analysis. Water samples flow through a reaction chamber with MUG reagent, excited by UV (365 nm) and blue (470 nm) LEDs, with fluorescence emission captured by a photodiode sensor and processed through optical filtering and signal amplification. The microcontroller aggregates signals from the optical pathway, lead and fluoride ion-selective electrodes, pH, turbidity, and temperature sensors into time-series datasets. This integrated approach enables simultaneous detection of microbial contamination and chemical parameters, critical for drinking water safety and environmental compliance. Fork this diagram on Diagrams.so to customize sensor configurations, add wireless transmission modules, or adapt the optical chain for your specific water quality parameters.
People also ask
How does a smart water monitoring system combine optical fluorescence sensing with chemical and environmental sensors to detect water contamination?
This diagram shows a dual-wavelength fluorescence spectroscopy system where water samples react with MUG reagent in a reaction chamber, excited by UV (365 nm) and blue (470 nm) LEDs. Fluorescence emission is captured by a photodiode, filtered, amplified, and digitized by an ADC. A microcontroller integrates this optical data with parallel environmental sensors (lead/fluoride ISE, pH, turbidity, te
- Domain:
- Other
- Audience:
- Environmental engineers and water quality monitoring system designers
Generated by Diagrams.so — AI architecture diagram generator with native Draw.io output. Fork this diagram, remix it, or download as .drawio, PNG, or SVG.