OS Activity Monitoring ER Diagram
About This Architecture
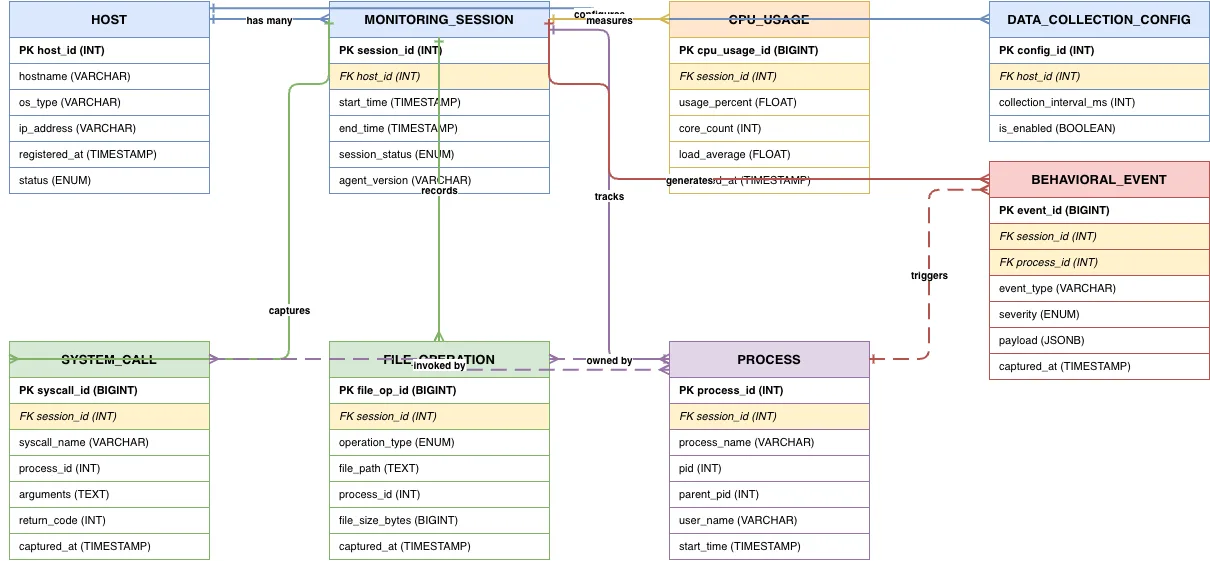
OS Activity Monitoring ER diagram models a comprehensive host telemetry schema capturing system calls, file operations, CPU usage, and process behavior across monitored hosts. The schema centers on MONITORING_SESSION, which aggregates HOST metadata and branches into five telemetry tables—SYSTEM_CALL, FILE_OPERATION, CPU_USAGE, PROCESS, and BEHAVIORAL_EVENT—each recording timestamped events with process-level context. This normalized structure enables security teams and platform engineers to correlate suspicious activity patterns, audit system behavior, and enforce compliance policies at scale. Fork this diagram on Diagrams.so to customize collection intervals, add threat intelligence joins, or extend behavioral event payloads for your monitoring stack. The design supports both real-time alerting and historical forensics through indexed session and process relationships.
People also ask
How should I design a database schema to capture and correlate system calls, file operations, and process behavior for OS activity monitoring?
This ER diagram provides a normalized schema centered on MONITORING_SESSION that links HOST metadata to five telemetry tables: SYSTEM_CALL, FILE_OPERATION, CPU_USAGE, PROCESS, and BEHAVIORAL_EVENT. Each table captures timestamped events with process context, enabling correlation of suspicious patterns and forensic analysis. The design supports both real-time alerting and historical compliance audi
- Domain:
- Data Engineering
- Audience:
- Database architects and DevOps engineers designing OS activity monitoring systems
Generated by Diagrams.so — AI architecture diagram generator with native Draw.io output. Fork this diagram, remix it, or download as .drawio, PNG, or SVG.