Industries Affected by Petrol Prices
About This Architecture
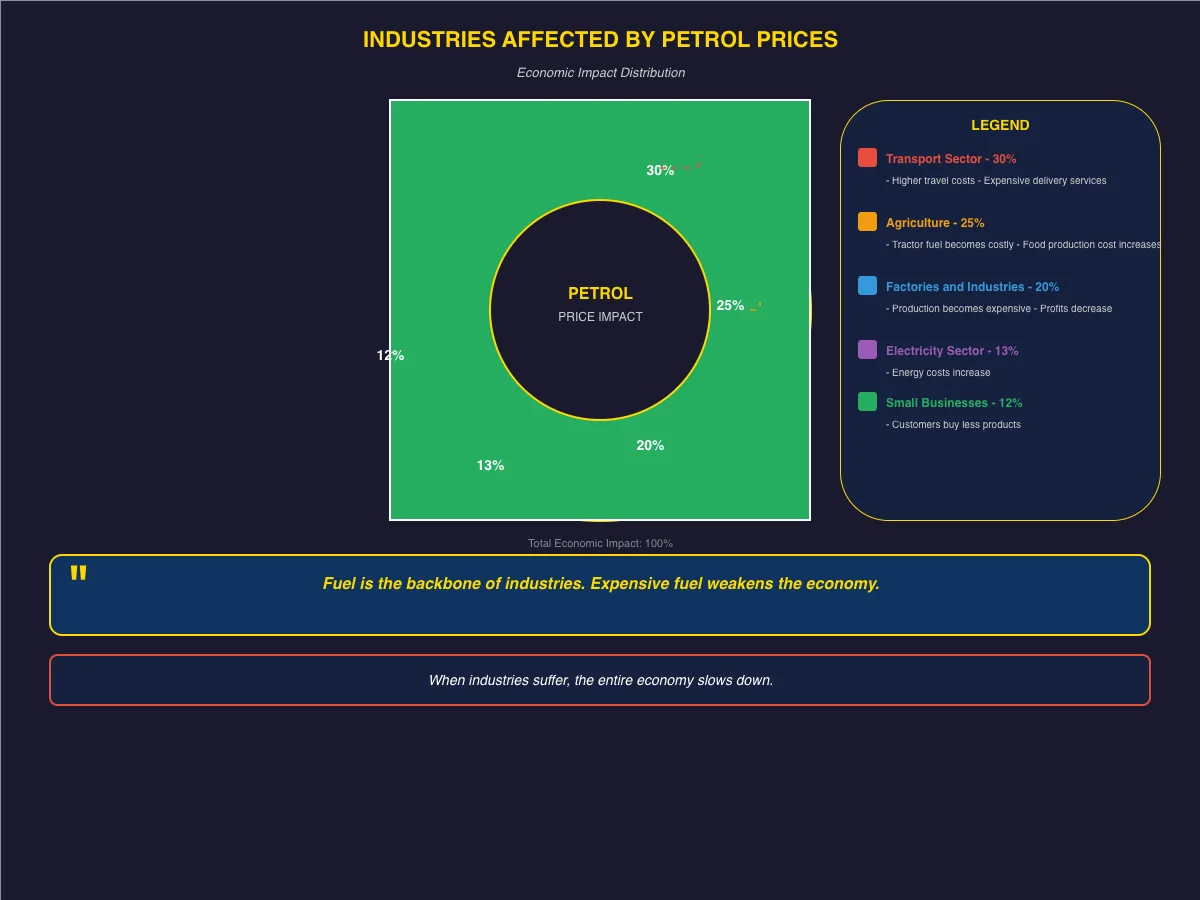
Economic Impact Distribution diagram visualizes how petrol price increases ripple across five critical sectors: Transport (30%), Agriculture (25%), Factories and Industries (20%), Electricity (13%), and Small Businesses (12%). Each sector faces cascading costs—from delivery surcharges and tractor fuel to production expenses and reduced consumer spending. This breakdown demonstrates why fuel costs are fundamental to macroeconomic health and inflation management. Fork this diagram to customize impact percentages for regional economies or add sector-specific mitigation strategies. The visualization reinforces that energy price shocks create systemic economic slowdowns affecting employment, food security, and business profitability.
People also ask
How do petrol price increases affect different industries and the broader economy?
Petrol prices create cascading economic impacts: Transport absorbs 30% through delivery costs, Agriculture 25% via tractor fuel and food production, Factories 20% through manufacturing expenses, Electricity 13% in generation costs, and Small Businesses 12% via reduced consumer demand. This 100% economic impact distribution shows why fuel is foundational to economic stability.
- Domain:
- Other
- Audience:
- economics students, policy analysts, and business strategists studying commodity price impacts
Generated by Diagrams.so — AI architecture diagram generator with native Draw.io output. Fork this diagram, remix it, or download as .drawio, PNG, or SVG.