Industries Affected by Petrol Prices
About This Architecture
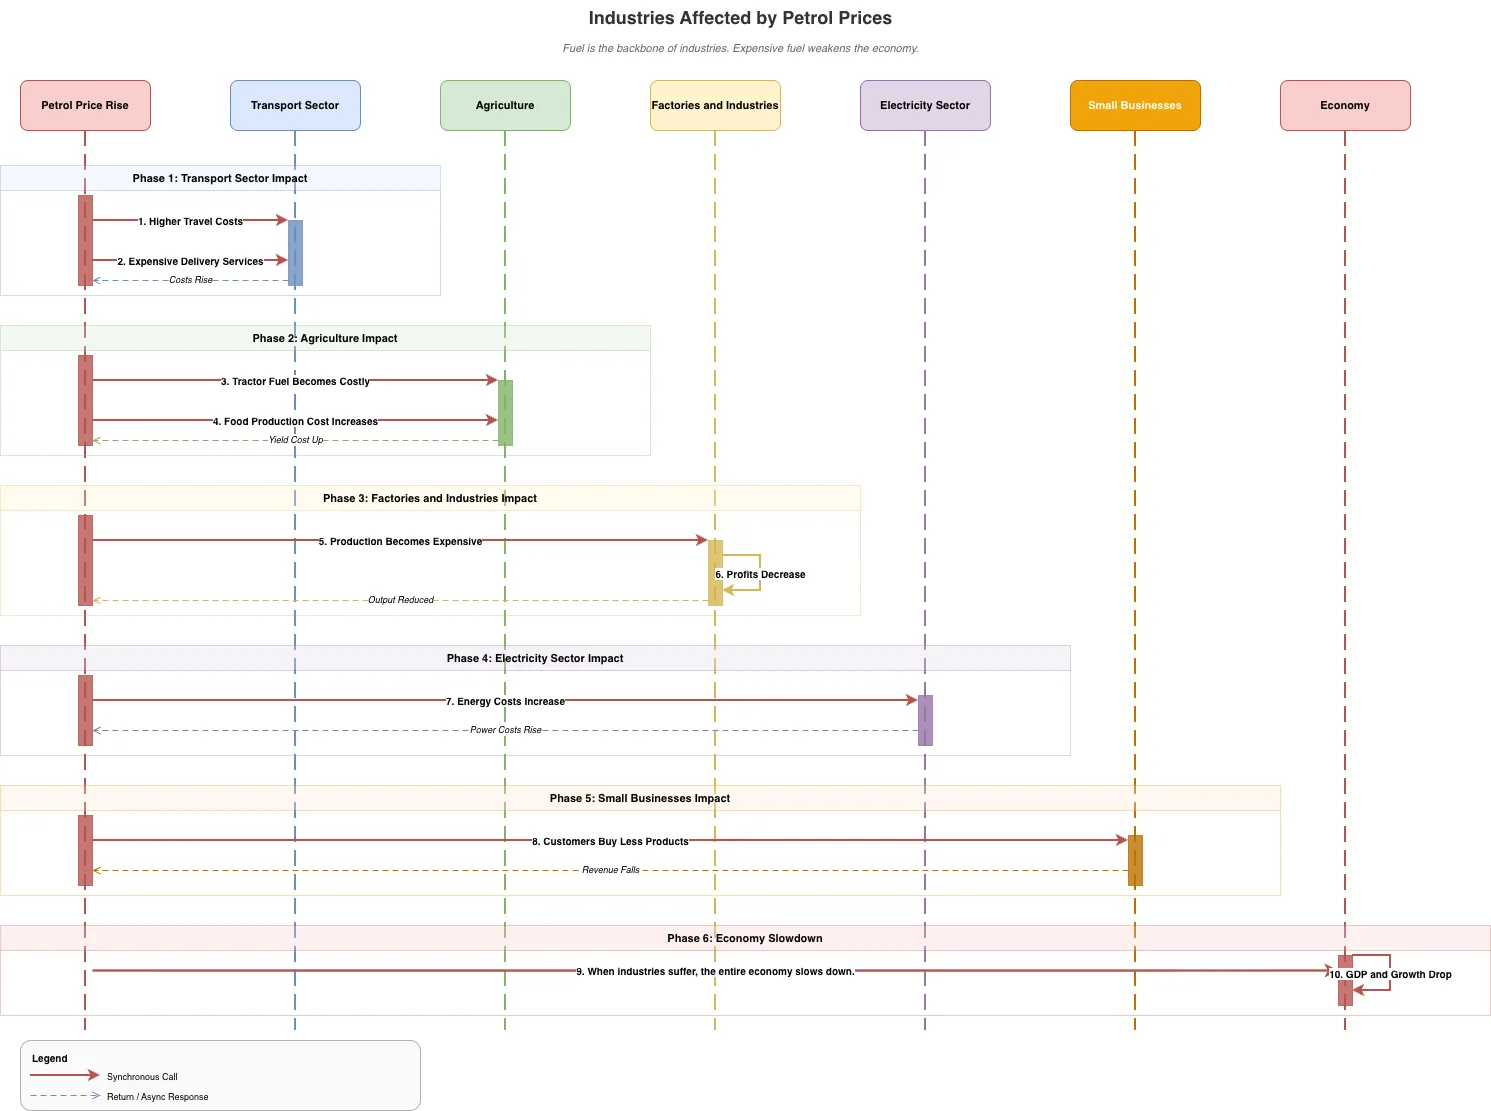
Petrol price increases trigger a cascading six-phase impact across transport, agriculture, factories, electricity, small businesses, and the broader economy. The sequence diagram traces how fuel cost escalation flows from the Transport Sector through Agriculture, Factories and Industries, and Electricity Sector, ultimately weakening economic stability. This architecture illustrates the interconnected nature of energy costs and demonstrates why fuel is the backbone of modern economies. Fork this diagram on Diagrams.so to customize phases, add regional variations, or embed in economic policy reports and business case studies.
People also ask
How do petrol price increases affect different industries and the overall economy?
This sequence diagram maps a six-phase cascade: petrol price rise first impacts the transport sector, then agriculture, factories and industries, the electricity sector, small businesses, and finally the broader economy. Each phase shows synchronous calls and responses, demonstrating how fuel cost escalation ripples through interconnected economic sectors.
- Domain:
- Other
- Audience:
- economics students, business analysts, and policy makers studying macroeconomic impacts
Generated by Diagrams.so — AI architecture diagram generator with native Draw.io output. Fork this diagram, remix it, or download as .drawio, PNG, or SVG.