Hadoop Ecosystem Data Processing Lifecycle
About This Architecture
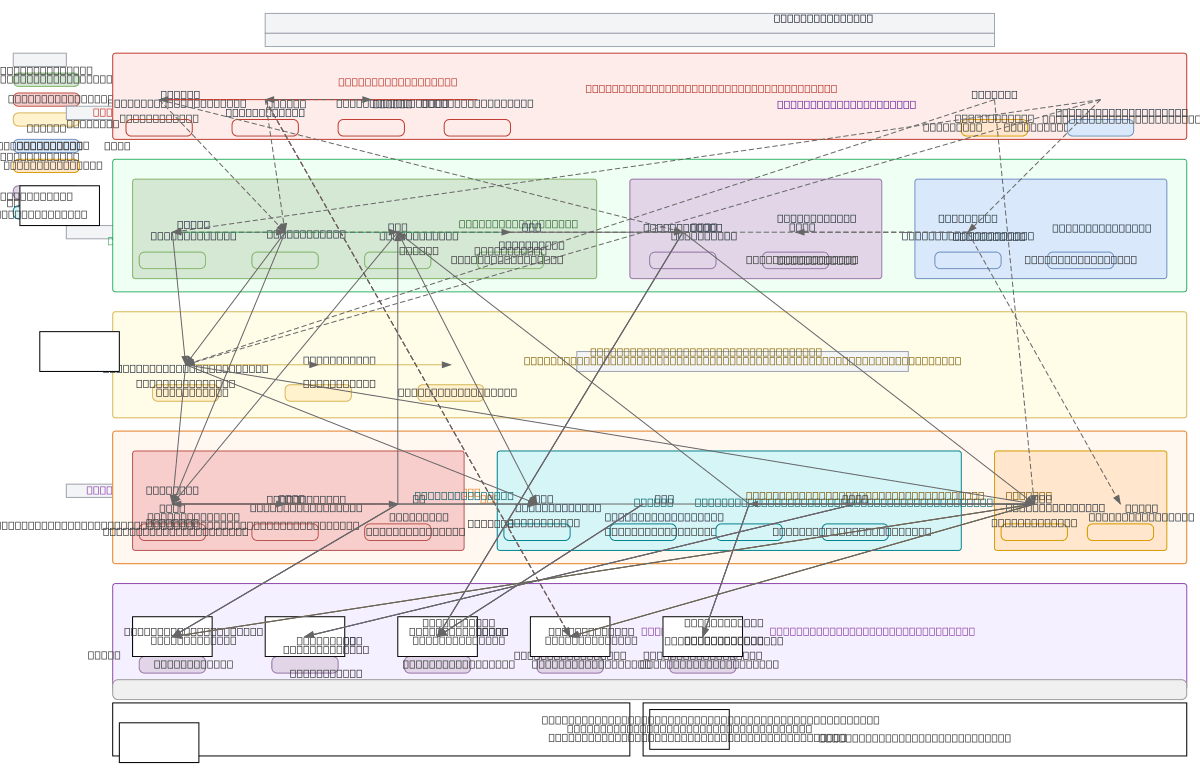
Hadoop Ecosystem Data Processing Lifecycle diagram maps the complete flow from ingestion through analysis, spanning Flume and Sqoop collectors, HDFS storage with NameNode/DataNode architecture, YARN resource management, and processing engines including MapReduce, Spark, and Hive. Data flows from web logs and RDBMS sources through the ingestion layer into HDFS blocks with 3x replication, then distributed across YARN containers to MapReduce jobs, Spark RDDs, or Hive queries for transformation. ZooKeeper provides coordination and Ambari enables cluster monitoring, while HBase offers low-latency NoSQL access for online workloads. This architecture demonstrates enterprise-grade data lake design with fault tolerance, scalability, and multi-workload support essential for large-scale analytics on OCI infrastructure. Fork this diagram to customize component placement, add OCI-specific services like Object Storage, or tailor resource allocations for your cluster topology. The layered design—ingestion, storage, resource management, processing, and query—provides a blueprint for architecting resilient data pipelines handling batch, streaming, and real-time analytics simultaneously.
People also ask
How does the Hadoop ecosystem architecture work end-to-end from data ingestion to analytics queries?
The Hadoop Ecosystem Data Processing Lifecycle diagram illustrates the complete flow: Flume and Sqoop ingest data from logs and RDBMS into HDFS, which distributes data across DataNodes with 3x replication managed by NameNode. YARN allocates resources via ResourceManager and NodeManager to processing engines—MapReduce for batch jobs, Spark for in-memory computing, and Hive for SQL queries—while Zoo
- Domain:
- Data Engineering
- Audience:
- Data engineers designing Hadoop-based ETL and analytics pipelines on OCI
Generated by Diagrams.so — AI architecture diagram generator with native Draw.io output. Fork this diagram, remix it, or download as .drawio, PNG, or SVG.