Gold Price Recommendation - UML Activity Diagram
About This Architecture
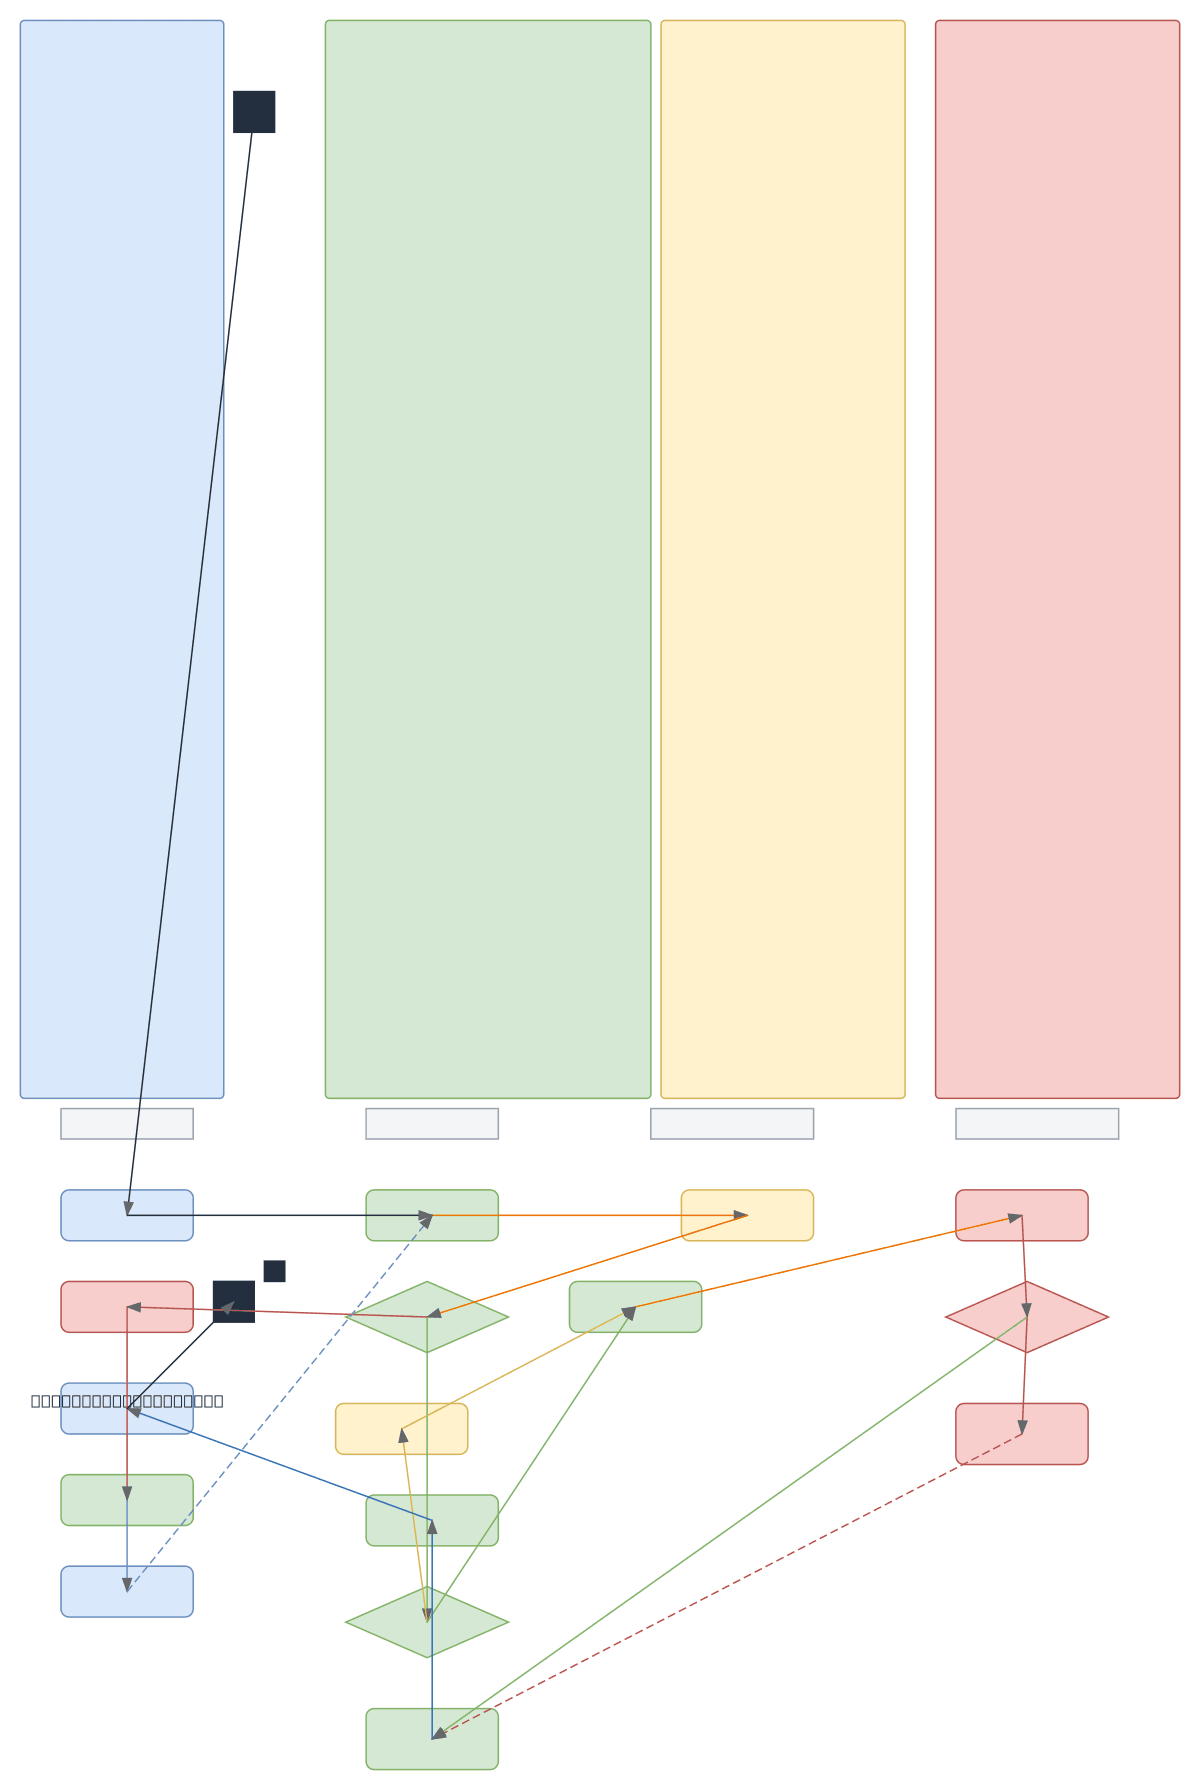
UML activity diagram modeling an AI-driven gold price recommendation engine that ingests real-time and historical market data. The system retrieves gold price data from external sources, validates completeness, and feeds clean datasets into a prediction module that forecasts future prices. If live predictions fail, the engine gracefully falls back to historical-data-only analysis before generating Buy/Sell/Hold recommendations. This workflow demonstrates best practices for resilient ML pipelines: error handling, data validation gates, and fallback logic that ensures users always receive actionable insights. Fork this diagram on Diagrams.so to customize data sources, add risk scoring, or integrate with your trading platform. The retry loop and partial-data warning path exemplify production-grade safeguards that prevent stale or incomplete recommendations from reaching end users.
People also ask
How do you design a machine learning pipeline that recommends gold investment decisions with data validation and prediction fallback?
This UML activity diagram shows a complete ML workflow: retrieve current and historical gold price data from external sources, validate data completeness, feed clean data into an AI prediction module, and generate Buy/Sell/Hold recommendations. If live predictions fail, the system gracefully falls back to historical-data-only analysis, ensuring users always receive actionable advice even when real
- Domain:
- Ml Pipeline
- Audience:
- Machine learning engineers and data scientists designing predictive recommendation systems
Generated by Diagrams.so — AI architecture diagram generator with native Draw.io output. Fork this diagram, remix it, or download as .drawio, PNG, or SVG.