GCP Smart City Water Pipeline - Real-Time ETL
About This Architecture
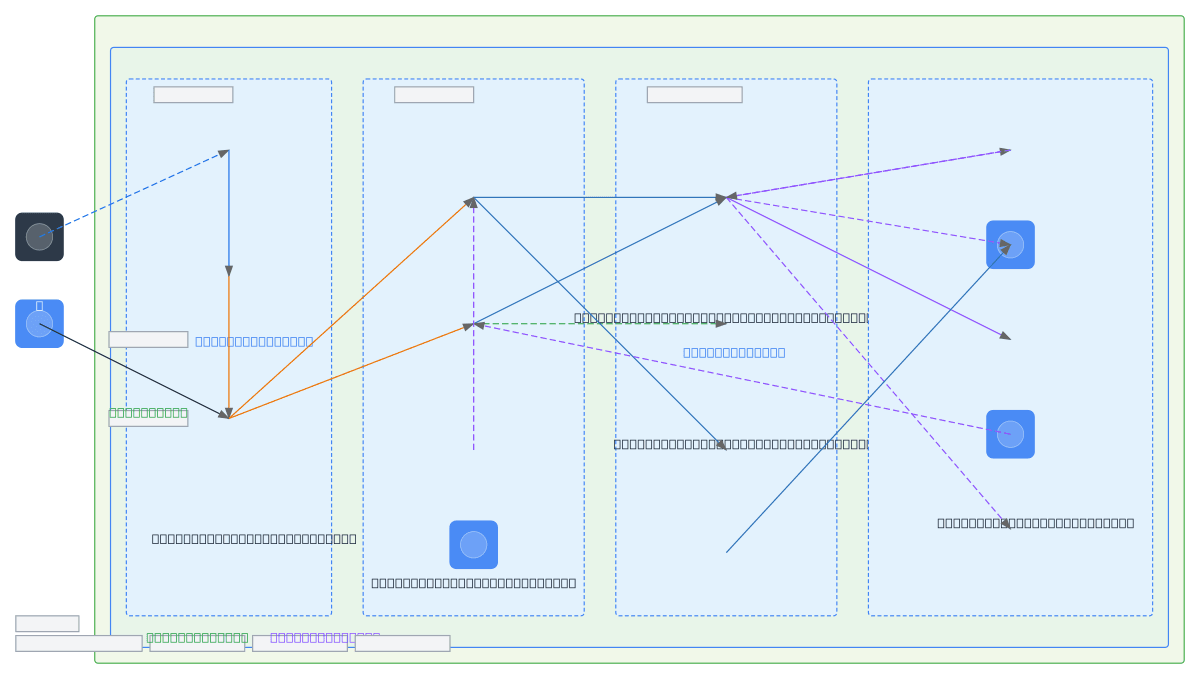
Real-time ETL pipeline ingesting IoT sensor data and field device files into a GCP smart city water management system. Data flows from IoT sensors and CSV/Excel sources through Cloud Pub/Sub and Cloud Functions into Cloud Dataflow for stream processing, with results landing in BigQuery, Cloud Spanner, and Cloud Storage across raw, curated, and aggregated tiers. Cloud Composer orchestrates workflows while Cloud Monitoring and Cloud Logging provide observability and audit trails across the entire pipeline. The architecture enables downstream analytics via Looker Studio dashboards, predictive modeling with Vertex AI and BigQuery ML, and advanced simulations through CFD-DEM integration. Fork this diagram to customize ingestion sources, processing logic, or storage strategies for your smart city or utility monitoring use case.
People also ask
How do I build a real-time ETL pipeline on GCP for IoT sensor data with stream processing, data warehousing, and machine learning?
This diagram shows a complete GCP smart city water pipeline: IoT sensors and field devices feed Cloud Pub/Sub and Cloud Storage, Cloud Dataflow processes streams in real-time, BigQuery serves as the central data warehouse, and Vertex AI enables predictive models. Cloud Composer orchestrates workflows while Cloud Monitoring and Logging provide full observability.
- Domain:
- Data Engineering
- Audience:
- Data engineers building real-time ETL pipelines for IoT and smart city applications on Google Cloud
Generated by Diagrams.so — AI architecture diagram generator with native Draw.io output. Fork this diagram, remix it, or download as .drawio, PNG, or SVG.