Flame Photometer Detailed Schematic
About This Architecture
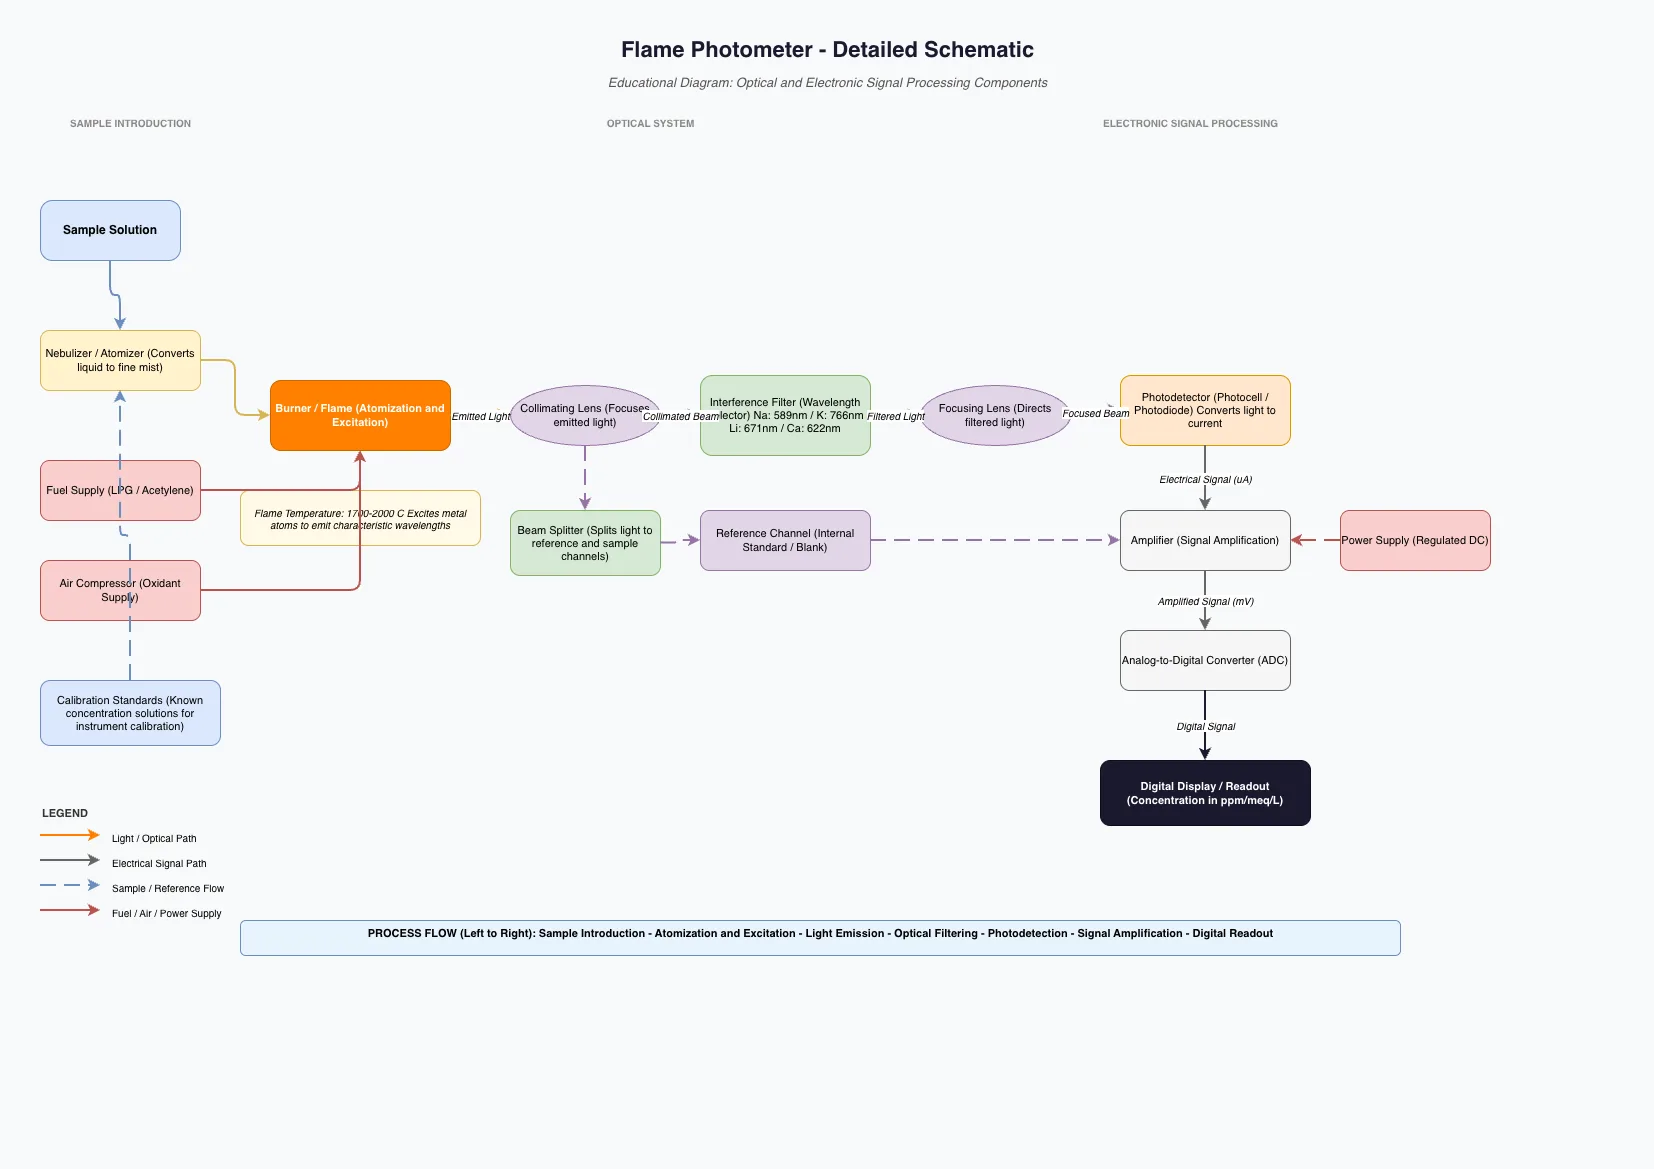
Flame photometer detailed schematic illustrates the complete optical and electronic signal processing pathway from sample introduction through digital concentration readout. The optical system comprises a nebulizer/atomizer, fuel supply, air compressor, and burner that excite metal atoms to characteristic emission wavelengths, followed by collimating lens, interference filter, focusing lens, and photodetector stages. Electronic signal processing includes amplification, analog-to-digital conversion, and calibration against reference standards with internal blank correction via beam splitter. This educational diagram demonstrates how flame photometry converts liquid samples into quantifiable light emissions for precise elemental analysis in clinical and research laboratories. Fork this schematic on Diagrams.so to customize component specifications, add measurement ranges, or adapt for teaching analytical instrumentation principles.
People also ask
How does a flame photometer convert liquid samples into measurable electrical signals for elemental analysis?
A flame photometer nebulizes the sample into a hot flame where metal atoms emit characteristic wavelengths. Optical components (collimating lens, interference filter, focusing lens) isolate and direct this light to a photodetector, which converts photons to electrical current. The signal is amplified, digitized via ADC, and compared against calibration standards to display concentration in ppm or
- Domain:
- Other
- Audience:
- analytical chemistry students and laboratory technicians learning flame photometry instrumentation
Generated by Diagrams.so — AI architecture diagram generator with native Draw.io output. Fork this diagram, remix it, or download as .drawio, PNG, or SVG.