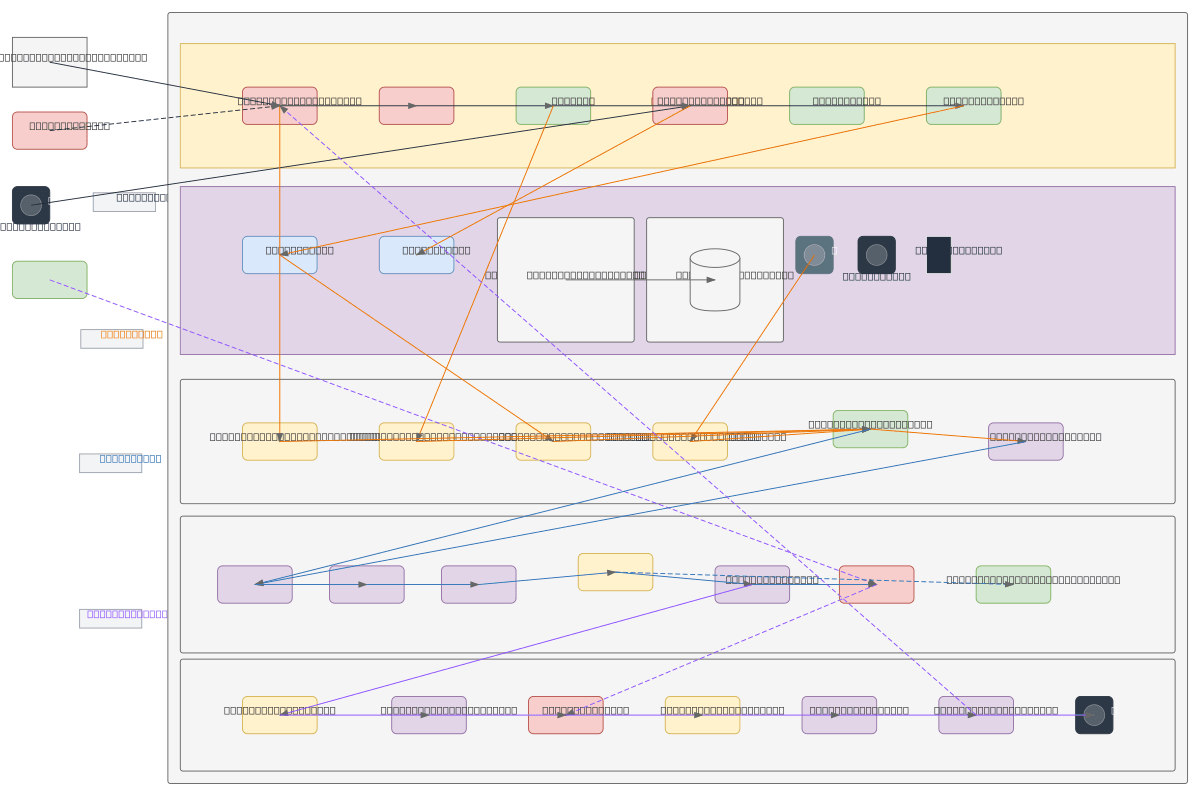
Enterprise SOC Architecture - Full Stack architecture diagram

About This Architecture

Enterprise SOC architecture integrating perimeter defense, centralized log collection, and SIEM processing into a full-stack security operations platform. Traffic from external users and threat actors flows through Firewall, WAF, and IDS/IPS before reaching internal assets, while logs from all security layers feed into a Log Server, Event Bus, and multi-stage SIEM pipeline including Parsing, Normalization, and Correlation engines. The SIEM Core generates alerts routed to SOC Console/SOAR for Incident Investigation and Threat Hunting, with results feeding Monitoring Dashboard, Reporting Engine, and Response Playbooks executed by SOC Analysts. This architecture demonstrates defense-in-depth with centralized visibility, enabling rapid threat detection and coordinated incident response across the enterprise.

People also ask

What does a complete enterprise SOC architecture look like from perimeter defense to incident response?

This diagram shows a multi-layered SOC architecture where external traffic passes through Firewall, WAF, and IDS/IPS before reaching internal assets. Logs from all security layers flow to a central Log Server, then through a SIEM pipeline with Parsing, Normalization, and Correlation engines that feed the SIEM Core and Alert Generator. Alerts route to SOC Console/SOAR for Incident Investigation and

Enterprise SOC Architecture - Full Stack

AutoadvancedSOCSIEMsecurity operationsthreat detectionincident responseenterprise security
Domain: SecurityAudience: Security architects and SOC directors designing enterprise threat detection and response infrastructure
14 views0 favoritesPublic

Created by

May 14, 2026

Updated

August 10, 2026 at 11:49 AM

Type

architecture

Need a custom architecture diagram?

Describe your architecture in plain English and get a production-ready Draw.io diagram in seconds. Works for AWS, Azure, GCP, Kubernetes, and more.

Generate with AI

AI-generated. Verify before production use. Learn more

Report this diagram