Crime Pattern Prediction System Architecture
About This Architecture
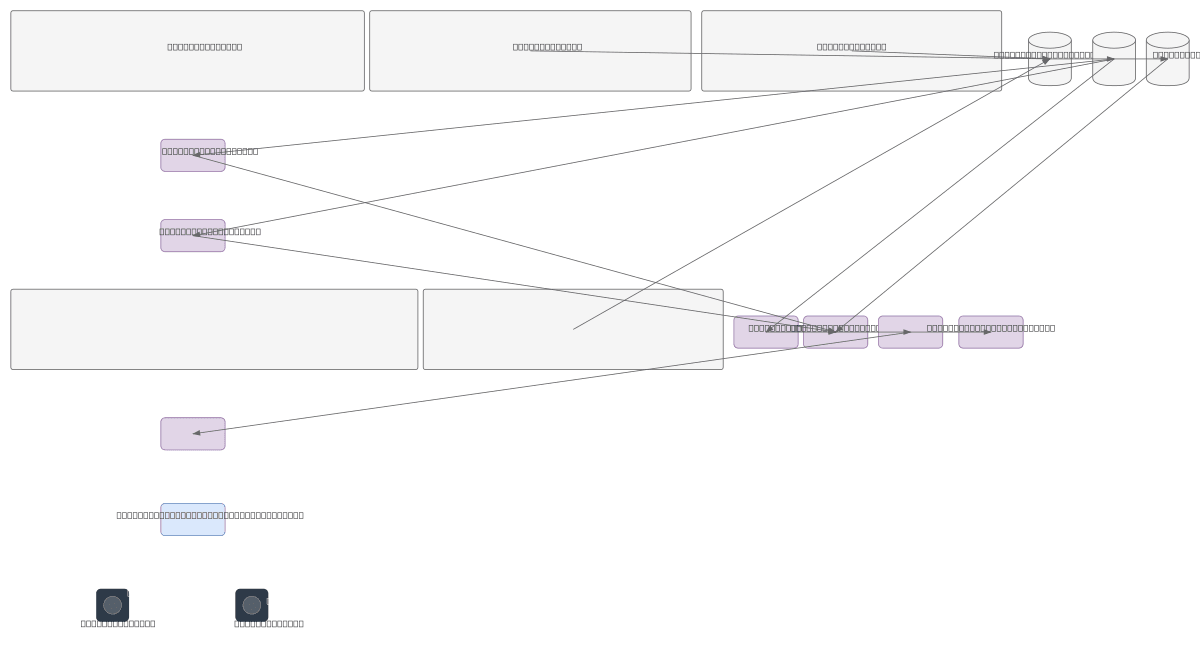
Crime pattern prediction system ingesting batch datasets (Chicago Crime, UCR, NYPD) and real-time sources (Kafka, Live Crime Feed API, IoT sensors) through parallel preprocessing and stream processing pipelines. Data flows through feature engineering (temporal, spatial, categorical) into PostgreSQL, Data Warehouse, and Redis Cache, feeding four specialized ML models: Random Forest for crime type classification, Gradient Boosting for risk scoring, LSTM for temporal patterns, and DBSCAN for hotspot detection. The Flask backend API with JWT/OAuth authentication serves predictions to a frontend crime map and dashboard, with WAF and CDN protecting the presentation layer for police officers and crime analysts. This architecture demonstrates best practices for combining batch and streaming data, feature engineering at scale, and multi-model ensemble inference in public safety applications. Fork and customize this diagram on Diagrams.so to adapt it for your jurisdiction's data sources, model choices, or deployment infrastructure.
People also ask
How do you build a real-time crime prediction system that combines historical crime datasets with live sensor and API data?
This diagram shows a complete ML pipeline ingesting Chicago Crime, UCR, and NYPD datasets alongside live Kafka streams and IoT sensors. Data preprocessing and feature engineering (temporal, spatial, categorical) feed four specialized models—Random Forest, Gradient Boosting, LSTM, and DBSCAN—for classification, risk scoring, pattern prediction, and hotspot detection, served via Flask API to crime a
- Domain:
- Ml Pipeline
- Audience:
- Data engineers and ML engineers building real-time crime prediction systems
Generated by Diagrams.so — AI architecture diagram generator with native Draw.io output. Fork this diagram, remix it, or download as .drawio, PNG, or SVG.