Create An Entity-relationship Diagram (erd) Using
About This Architecture
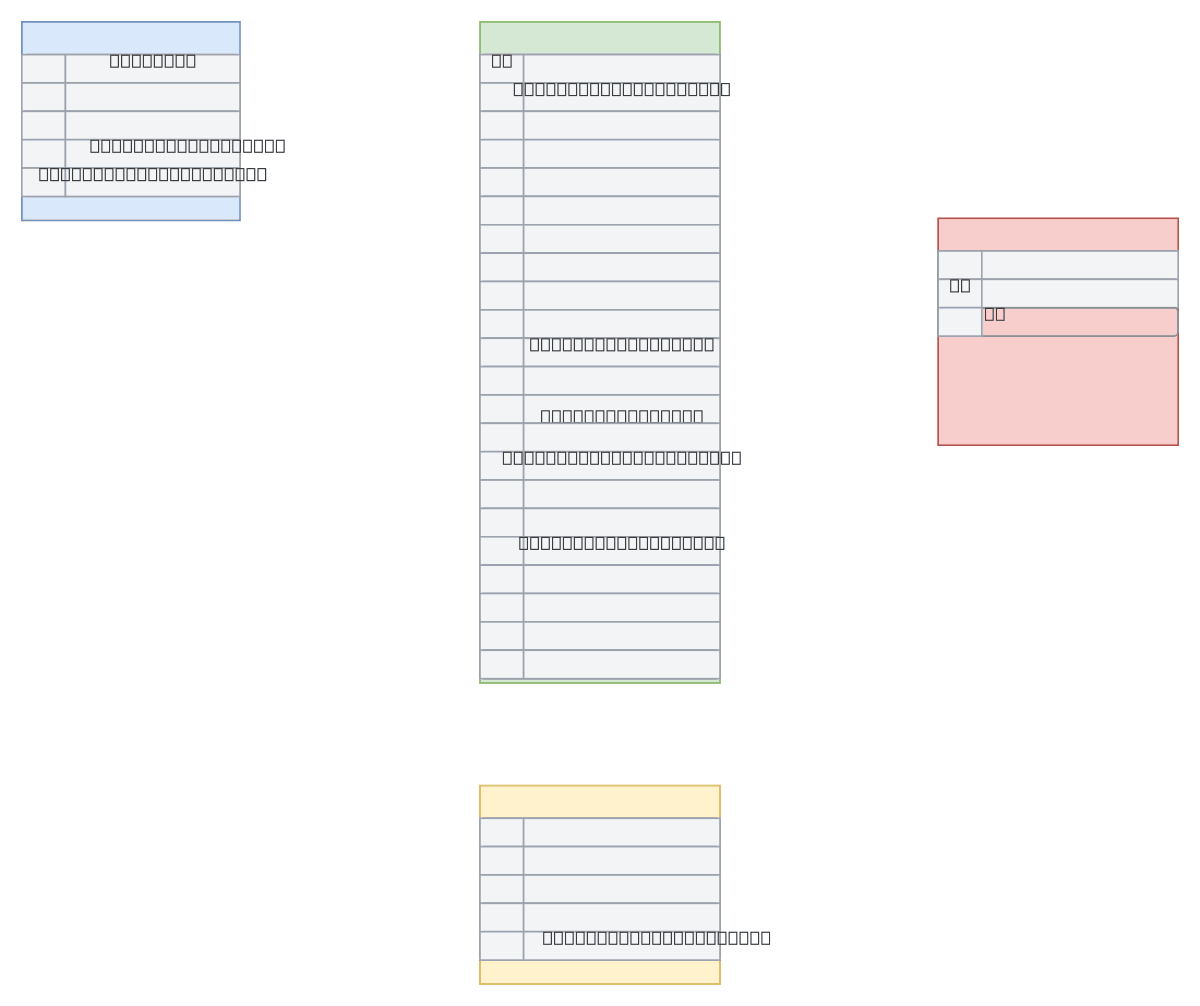
Entity-relationship diagram modeling a resident management system with four core tables: staff, residents, family_relationships, and activity_log. The schema captures staff authentication and audit trails via staff credentials and activity logging, while the residents table maintains comprehensive demographic, socioeconomic, and household data including age, civil status, PWD and senior citizen flags, and educational attainment. Family relationships are tracked through a junction table linking residents as relatives with relationship type descriptors, enabling multi-generational household mapping. This ERD demonstrates best practices for normalized database design in civic/social services applications, separating concerns across authentication, demographics, relational data, and audit trails to support queries on vulnerable populations and household composition.
People also ask
How do you design a database schema to track residents, their family relationships, and staff activity in a civic management system?
This ERD shows a normalized four-table design: staff stores authentication credentials, residents captures 20+ demographic and socioeconomic fields including household membership, family_relationships links residents as relatives with relationship types, and activity_log audits staff actions. Primary and foreign keys enforce referential integrity across household and family hierarchies.
- Domain:
- Data Engineering
- Audience:
- Database designers and backend developers building resident management systems
Generated by Diagrams.so — AI architecture diagram generator with native Draw.io output. Fork this diagram, remix it, or download as .drawio, PNG, or SVG.